What impact will energy data for 110 million homes have on the energy efficiency industry?
By: Ryan Meres, RESNET Programs Director
For more than a decade studies have consistently shown that home buyers want energy-efficient features, but few are aware of the impact those features have on energy cost. The average U.S. homeowner spends more on energy than property taxes and insurance, but energy is the only one of those three common expenses not considered in the mortgage process. The announcement and report released by the Rocky Mountain Institute (RMI) that real estate platforms have begun including energy information in their listings is a significant step toward reducing the barrier to the transparency of energy use in the home-buying process.
The Big Announcement
RMI announced that through UtilityScore homeowners or potential buyers can receive a score and estimated energy costs for homes listed on its site. Meanwhile, Redfin, one of the top 10 real estate platforms, is working with Tendril to provide an Energy Score for all homes on its platform, not just those listed for sale. RMI estimates that 110 million homes are now covered on these two platforms.
Impact of Transparency
The energy scores and estimated costs that Tendril and UtilityScore provide for residential real estate listings are based on estimates that use the following variables:
- Home size
- Home age
- Heating type
- Cooling type
- Local climate
- Other home characteristics (if known), including renewable energy, insulation levels, pool, or spa
Although there can be discrepancies in how the estimated energy costs compare to actual costs, homeowners can claim their home on these platforms and adjust for any facts that are incorrect or to account for energy efficiency upgrades and their score will update accordingly.
We can look at the commercial sector to see the impact that energy transparency has on energy use. Studies have shown that in cities with benchmarking and transparency laws where buildings are required to disclose energy consumption, energy use has decreased between two and nine percent in just three years.
The Good, The Bad, and The Confusing
It’s obvious that transparency is a good thing when it leads to competition for improving the energy efficiency of homes. Giving potential homebuyers a rough estimate of the energy use of a home provides an excellent platform for incorporating energy use in home-buying decisions. However, this doesn’t mean that energy consumption will get factored into the mortgage underwriting or appraisal process (which is the ultimate goal in order to provide value for energy efficiency). Unfortunately, the rough estimates provided by Tendril and UtilityScore are not robust enough for lenders or appraisers to use in their decision-making.
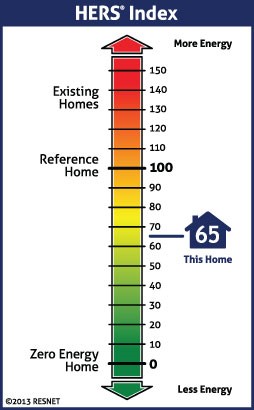
For more than two decades, the Residential Energy Services Network (RESNET) has championed that energy efficiency be valued in the real estate transaction process as part of our Home Energy Rating System (HERS). In fact, one study showed that homes with lower HERS Index scores had a 32% lower mortgage default rate. In the past 10 years, more than 2 million homes have been HERS Rated. The HERS Index is based on a scale of 100-0, where 0 is more efficient 100 (a home that scores a zero is considered a net-zero energy home). Unfortunately, the energy scores produced by UtilityScore and Tendril use a 0-100 score, where 100 is more efficient than 0.
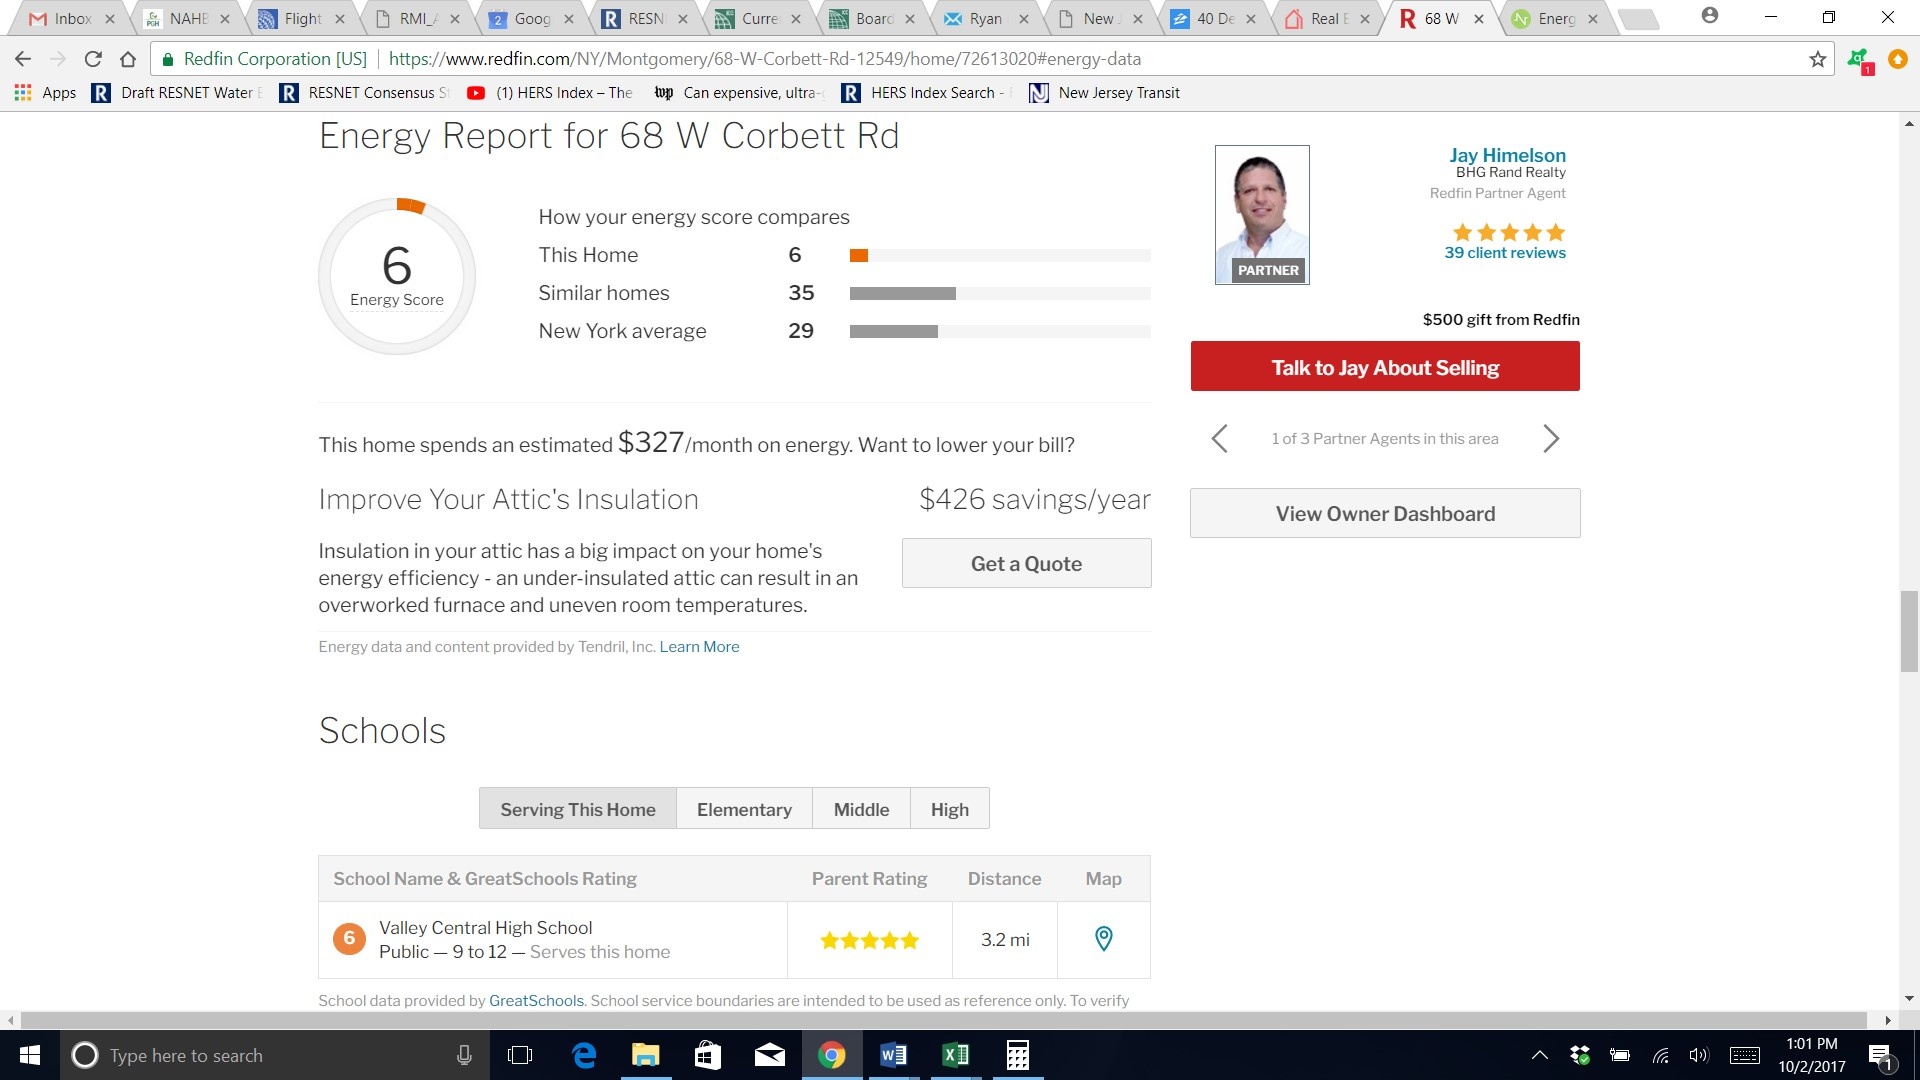
 This inverted scale will lead to significant market confusion, which is unfortunate because HERS-Rated homes are verified by an independent, certified HERS Rater through both energy modeling as well as on-site inspection and testing. RESNET is also launching a new Appraiser Portal that will allow appraisers to verify the HERS Index score of a home, view its estimated energy costs and compare that home to other nearby HERS Rated homes. This new portal developed in collaboration with the Appraisal Institute (the largest not-for-profit real estate appraisal organization in the United States with nearly 19,000 professionals) is expected to greatly improve appraiser access to important energy cost information of homes. Similarly, as it will do with home buyers, having an inverted scale will create confusion among appraisers as well. The two graphics at right and below show the difference between an Energy Score listed on Redfin and the HERS Index.

What’s the Difference Between HERS Index Estimates and Energy Score Estimates?
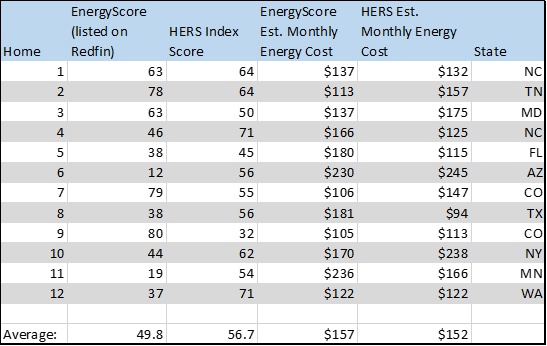
To get an idea for the differences between the estimated energy costs in Tendril’s Energy Score and RESNET’s HERS Index, I conducted a very rough comparison between 12 homes that have both a confirmed HERS Rating and an Energy Score listed on Redfin. These 12 homes were located in 10 geographically dispersed states. Here is a chart of the results:

Of the 12 homes, four had an energy cost difference of less than 10%, while 7 had a difference between 25 and 50 percent; and just one home had a greater than 50% difference. Understanding the algorithms behind the Energy Score would allow for a better analysis of the differences that create the disparity in energy cost estimates. For example, home # 9, above, contains solar panels, which are given credit on both the Energy Score and HERS Index. This home scores very well on both scales and has only a small difference in estimated monthly energy cost. Home #8 has only an 18-point score difference, but nearly double the estimated energy cost on Energy Score compared to the HERS Index.
Conclusions
Providing energy use estimates in real estate listings is sure to drive reductions in energy use which is good news for the residential energy efficiency industry. It is also this industry that will be educating consumers and others involved with real estate transactions about the differences between an independently verified energy label, like the HERS Index Score and a remote estimate, like Energy Score. Better collaboration among energy data providers could help improve the accuracy of energy cost estimates.
The views, opinions and positions expressed within these guest posts are those of the author alone and do not represent those of the North American Insulation Manufacturers Association (“NAIMA”). These blogs are provided to facilitate dialogue and exchange of views and information and do not imply NAIMA’s endorsement or sponsorship of any statement found therein. The accuracy, completeness and validity of any statements made within these blog posts are not guaranteed. Reliance upon any statement, information, or opinion contained herein is to the users’ detriment and at their own risk. NAIMA assumes no liability for any errors, omissions or representations. The copyright of this content belongs to the author and any liability with regards to infringement of intellectual property rights remains with them.
